Background
As defined, the Efficient Market Hypothesis states that all of the available information is always fully reflected in the current prices of securities. This also implies that expectations or predictions of future information are also reflected in the current prices of securities. As a result, once future information is realized, any changes in the current prices of securities must be unexpected and resemble randomness or random-walk behaviour, especially in the short-term, since there is no reason for uniformity in the distribution of possible unpredictable outcomes. The uncertainty around this information is said to be reflected in the current prices of securities based on a discount rate, as the current price of a security can be seen as the present value of expected future cash flows which is equal to the ratio of the sum of expected future cash flows and discount rate of those cash flows relative to the time horizons of those cash flows - higher expected future cash flows increase the price, while higher discount rates decrease the price. So, the discount rate represents a risk being reflected in the current price of a security and only future information affects the discount rate and expected future cash flows for a security once it is realized.
As an illustration of the Efficient Market Hypothesis, suppose a piece of information about the value of a security is widely available to investors. If the current price of the security does not already reflect this information, then investors will subsequently compete to trade on this information for their own self-interest and, thereby, change the current price of the security to reflect this information. In other words, if participants in a market think that a security is undervalued at its current price based on available information, then they will buy it and increase the price until it reaches a fair price and, if participants in a market think that a security is overvalued at its current price based on available information, then they will sell it and decrease the price until it reaches a fair price. This creates an equilibrium between supply and demand and also leads to securities having a price which is the best guess or aggregate of the accepted price by all of the participants in the market, where prices will efficiently adjust to equalize any changes in supply and demand from the participants in the market - as a result, any mispricing is unbiased. In a sense, the current price of a security becomes a mechanism to collect disperse bits of information about fundamental values and expectations from all of the participants in the market to provide accurate signals for capital allocation. This information is dispersed as it is not possible for any individual participant in the market to have access to all of the available information, but the cumulative decisions of all of the participants in the market must include all of the available information (otherwise the information is not available, since no participants in the market have access to it), such that the current price of a security is the result of all of the available information. Thus, the current price of a security should only rationally change once future information which is unexpected is introduced into the market, such that the accepted price by all of the participants in the market proportionally reacts to this future information.
The idea of risk forms a crucial part of the Efficient Market Hypothesis, but it can be difficult to define and even more difficult to measure. Broadly, the risk in a decision from a participant in the market can be reasonably defined as the uncertainty about the future consumption related to that decision (more things can happen than will happen as risk increases). This is based on the assumption that the participant in the market plans or anticipates to use their wealth in the future for this consumption, such that it subsequently implies that risk may vary based on characteristics like location, regulations, taxes, costs, time horizon, available investments, risk capacity, current capital, projected income or human capital, expected returns, sequence of returns through multiple periods, sensitivity to economic events, sensitivity to recessions, and overall goals of consumption. It is also assumed that the participants in the market are risk averse and rationally prefer the lowest uncertainty, likelihood of failure, potential for loss, variance, and co-variance with other preferences for a level of expected return (or, equivalently, rationally prefer the highest expected return for a level of uncertainty, likelihood of failure, potential for loss, variance, or and co-variance with other preferences). It should be noted that these participants in the market may be children, college graduates, working professionals, retirees, institutions, endowments, and many other classifications with different characteristics, while the decisions may be related to discretionary spending, charitable donations, legacy gifts, and many other classifications with different characteristics.
Importantly, this highlights that risk or perception of risk can vary based on a decision, where the risk-free option for one decision may be different to the risk-free option for another decision. This risk can then be aggregated for all of the decisions from a participant in the market to obtain the overall risk for a unique situation based on their lifetime consumption and, for the underlying relationships of the market, further aggregated for all of the participants in the market and their own unique situations to obtain the overall risk of the market. Unfortunately, the aggregated risk of all of the participants in the market cannot be known, as their individual ability, willingness, and need to take risk cannot be discerned from the information which is available. This does create an initial paradox, as the participants would need to know the risk of securities in order to actually make decisions in the market about those securities and their unique situations. For this reason, a proxy for risk is often used as an estimated indicator, such as the volatility, variability, maximum drawdown, or distribution of outcomes, but these proxies are ultimately a substituted approximation of the actual underlying risk. In this way, the risk-free rate is often assumed to be a predictable short-term bond from a reliable government with a negligible chance of defaulting, as it is reasonable to assume that the majority weight of consumption from participants is aligned with short-term obligations.
This also implies that there can be preferences reflected in prices in the form of demand and supply for non-financial utility. These preferences can be related to risk, as there must be an underlying reason which is common enough for a sufficient group of participants to hold these preferences without being able to diversify away from them. For example, there may be preferences for environmental impact, hyping up a brand, inclusion in an index, looking for lottery payoffs, religious screening, political ideology, national or cultural influences, and so on (others often say that these are inefficiencies, but it would be more accurate to view them as preferences being reflected in prices just like any other information would be reflected in an efficient market - enough participants view these unique ideas as valuable in one way or another). In most cases, the discount rate is usually the largest proportion of the price, but it is still perfectly rational for there to also be preferences in the price and these could work in the same direction as discount rates (increasing the price of a security) or in the opposite direction as discount rates (decreasing the price of a security).
With regard to the average investor, all of the participants must collectively hold the global market portfolio of all of the equities, bonds, and other securities, as every asset in a market must be owned by a participant in the market at every point in time. Thus, if weighted by the value of investments, the average investor must hold the global market portfolio when aggregated for all of the participants. Because of this, it is a rational idea for any investor to start with a global market portfolio and then deviate from this portfolio based on how their unique situation deviates from the situation of the average investor. This deviation may be based on various characteristics of risk in terms of their ability, willingness, and need to take risk, like location, regulations, taxes, costs, time horizon, available investments, risk capacity, current capital, projected income or human capital, expected returns, sequence of returns through multiple periods, sensitivity to economic events, sensitivity to recessions, and overall goals of consumption. However, this deviation should be applied cautiously, as a precise analytical solution to a complicated and poorly-defined problem with variable uncertainty is likely to be futile and unreliable.
In other words, if there are certain features of a security leading to underperformance when those features are realized, those securities will be priced lower than other securities without these features, as an investor accepting this risk needs to be compensated for accepting it. However, this security is now having a lower price (higher return) without considering the volatility of that security. Thus, this results in a security with a higher return for the same volatility and, when looking at the risks of this security, the security is in some ways riskier than other securities through features unrelated to volatility. These features are hedging constraints (characteristics which an investor cannot easily hedge away and, so, must avoid if they do not want to accept). Looking at risk-adjusted returns, when viewed from the perspective of volatility, a portfolio accepting these additional risk has a higher risk-adjusted return. However, when viewed from the perspective of volatility and hedge constraints, the portfolio accepting these additional risks has the same risk-adjusted return. Thus, the market portfolio is the mean-variance optimal portfolio plus the hedging portfolios that hedge risks other than volatility - largest possible expected returns, given return variances and covariances of returns with the relevant factors, but not the largest possible expected return per unit of volatility. These features can then be seen as preferences and identified through risk factors.
Going into more detail, a mean-variance efficient portfolio is a portfolio that maximizes expected return for a level of risk (or minimizes risk for a level of expected return). In theory, there has to be a mean-variance efficient portfolio. With a single market factor (CAPM), the market portfolio is the mean-variance efficient portfolio, such that the decision to weight securities based on market capitalization is optimal. However, with multiple risk factors (ICAPM), the market portfolio is not mean-variance efficient portfolio and an investor seeking mean-variance efficiency must tilt toward the risk factors. In this case, the market portfolio is multifactor efficient (efficient to the hedging constraints of the average investor), but it is theoretically possible to improve mean-variance efficiency by tilting away from weights based on market capitalization (at the expense of multifactor efficiency). In practice, however, the improvement in mean-variance efficiency is likely to be small and may not justify the additional complexity and costs associated with tilting - most investors want to hold multifactor efficient portfolios rather than mean-variance efficient portfolios (by definition of the average investor).
Risk Factors
Given capacity for risk (relative to the consequences of that risk in its various forms) and without having specific biases for other preferences, it makes sense for an investor to target the highest discount rates and avoid anything with significantly increased prices due to preferences. To do this, risk factors and how they interact with the discount rate can defined. The definition of a risk factor should be robust, independent, and unique enough to be reliably identified with a basis as to why it would affect the discount rate. Thus, the equation for the price of a security as the present value of expected future cash flows can be expanded to include the effects from risk factors as follows:
This shows that risk factors can be defined based on the relationship characteristics. The market factor is defined as the excess return of the market portfolio over the risk-free rate; size factor is defined as the excess return of small-cap companies over large-cap companies; value factor is defined as the excess return of high book-to-market companies over low book-to-market companies; profitability factor is defined as the excess return of robust profitability companies over weak profitability companies; and investment factor is defined as the excess return of conservative investment companies over aggressive investment companies. It should be noted that the size factor is often considered to be a proxy for risks such as capital constraints, liquidity restrictions, financial distress, higher leverage, credit-condition sensitivity, and procyclicality, but it often empirically behaves inconsistently over time with less robust theoretical definitions from first principles.
For the market factor, if equities offered the same expected return as the risk-free rate, there would be no reason to hold them due to their inherently higher volatility and, so, in order to be compensated for this volatility, a premium must be expected from market beta. This dynamic is fundamental with volatility being directly associated with the uncertainty and accompanying risk, as well as the other risks seen in the history of equities. This is also clearly observed with the risk-free rate being reflected in the price as the baseline of the discount rate.
For the value factor, if an equity with a high book-to-market ratio and equity with a low book-to-market ratio had the same market price, it would be expected for the equity with a high book-to-market ratio to have a higher expected return than the equity with a low book-to-market ratio, as a high book-to-market ratio (low price-to-book) has a greater discount rate being applied than a low book-to-market (high price-to-book) ratio, such that a premium must be expected from the value factor to compensate for this risk. This is observed in the expected change in book value, where, if other variables are held constant constant besides the market price and discount rate, an equity with a lower market price and higher book-to-market (lower price-to-book) ratio at the same expected cash flow must have an associated risk premium in the discount rate being reflected in the market price relative to an equity with a higher market price and lower book-to-market (higher price-to-book) ratio at the same expected cash flow (otherwise there would be no reason for them to have the same market price).
For the profitability factor, if an equity with a high quality and equity with a low quality had the same market price, it would be expected for the equity with a high quality to have a higher expected return than the equity with a low quality, as excess gross profits with higher cash flows would imply a riskier outlook discounting these gross profits compared to reduced gross profits with lower cash flows, such that a premium must be expected from the profitability factor to compensate for this risk. This is observed in the expected future earnings, where, if other variables are held constant besides expected future earnings and discount rate, an equity with higher expected future earnings at the same market price must have an associated risk premium in the discount rate being reflected in the market price relative to an equity with lower expected future earnings at the same market price (otherwise there would be no reason for them to have the same market price).
For the investment factor, if an equity with a conservative asset growth and equity with an aggressive asset growth had the same market price, it would be expected for the equity with a conservative asset growth to have a higher expected return than the equity with an aggressive asset growth, as a conservative asset growth (focussed on more certain income) with a lower expected change in book value would imply a riskier outlook discounting this asset growth compared to an aggressive asset growth (focussed on more uncertain growth) with a higher expected change in book value, such that a premium must be expected from the investment factor to compensate for this risk. This is observed in the expected cash flow (from investments), where, if other variables are held constant besides expected change in book value and discount rate, an equity with a lower expected change in book value (from the asset growth of investments) at the same market price must have an associated risk premium in the discount rate being reflected in the market price relative to an equity with a higher expected change in book value (from the asset growth of investments) at the same market price (otherwise there would be no reason for them to have the same market price).
Since these risk factors are systemic, they cannot be diversified or arbitraged away. It is important to note the difference between systemic or compensated risk factors and ideosyncratic or uncompensated risk. Systemic or compensated risk is fundamentally inherent to the market in order to earn a return above the risk-free rate and can only be avoided by reducing exposure to a sufficient number of securities related to the relevant risk factors. Idiosyncratic or uncompensated risk is specific to a particular security or group of securities and can be diversified away by holding a sufficiently large number of securities. Thus, the cross-section of expected returns in the market can be decomposed into the risk-free rate plus the premiums from the relevant systemic or compensated risk factors, while the idiosyncratic or uncompensated risk does not contribute to the expected return of a security (apart from a random error depending on the diversification of the portfolio and reflecting that the dispersion of the portfolio must be higher due to the unreliability in the construction of the portfolio with idiosyncratic characteristics - how unlikely it is for the actual result to be inline with the expected result (size of the range of possible outcomes)).
A similar result can be found through a residual income valuation model. This model is based on the well-known thesis from the field of accounting that the value of net assets for a company at the end of the forecast period is equal to their value at the beginning of the period plus profit for the period and minus dividends paid - in other words, the model assumes that the value of a company equals the present value of future residual incomes discounted at the cost of equity ("residual" means in excess of any opportunity costs measured relative to the book value of shareholders' equity, so residual income is then the income generated by a company after accounting for the true cost of capital). The market value can then be decomposed into two components: book value of equity and present value of residual income (which is an estimation of the free cash flow available after return requirements have been satisfied (usually through dividends), such as economic value added, abnormal return, alpha, etc). As is seen, this model is directly related to the market-to-book ratio and its inverse book-to-market ratio. If markets are efficient and prices are set correctly, then a higher discount rate, all else equal, must imply a lower market-to-book ratio (or, alternatively, a higher book-to-market ratio). Going further, a lower return on equity (bundling operating profitability (margins and efficiency) with capital structure (leverage)), all else equal, must also imply a higher book-to-market ratio. Similarly, a lower expected growth in book equity (bundling reinvestment of retained profits with payout policy through dividends, since the change in book equity over each period is profit retained net of dividends paid), all else equal, must also imply a higher book-to-market ratio. The relationship to expected return is seen by holding return on equity and expected growth in book equity constant, where a higher book-to-market ratio demands a higher discount rate and reveals the risk in the value factor. Equally, holding the book-to-market ratio and expected growth in book equity constant, a higher return on equity demands a higher discount rate and reveals the risk in the profitability factor. Finally, holding the book-to-market ratio and return on equity constant, a higher expected growth in book equity demands a higher discount rate and reveals the risk in the investment factor.
Excess return of a value-weighted market portfolio over the one-month risk-free rate. The compensation for bearing undiversifiable market risk.
Average return on companies with small market capitalizations minus the average return on companies with large market capitalizations.
Average return on companies with a high book-to-market ("value") minus the average return on companies with a low book-to-market ("growth").
Average return on companies with robust operating profitability minus the average return on companies with weak operating profitability.
Average return on companies investing conservatively (low asset growth) minus the average return on companies investing aggressively (high asset growth).
Factors By Region
In the construction of the data, the returns are in USD and include dividends and capital gains for the period without fees or taxes and without continuous compounding (unless specified as annualized). The return from market beta is equal to the difference in return between a value-weighted market portfolio and the one-month risk-free rate. The return from the size factor (Small Minus Big) is the average return using the equally-weighted combinations of groups which were formed using the value factor, profitability factor, and investment factor. For the value factor (High Minus Low), profitability factor (Robust Minus Weak), and investment factor (Conservative Minus Aggressive), the portfolios are sorted into two groups for market capitalization (with the upper 90% of equities with the highest and lower 10% of equities with the lowest market capitalization) and three groups respectively for book-to-market equity, operating profitability, or change in investment assets with breakpoints at the 30th and 70th percentiles for the relevant multiples (middle group is seen as neutral or blend).
As a measure of the association between the factors, the correlations can be considered relative to the realized returns. These considerations can be related to Modern Portfolio Theory, where it is asserted that diversification and reduced risk of losses can be achieved by minimizing the correlation of securities within a portfolio. In other words, between securities within a portfolio with positive expected returns, a perfect positive correlation increases the standard deviation of the portfolio, but an imperfect positive or negative correlation will always decrease the standard deviation. However, it should also be kept in mind that, due to changes between periods, these correlations may not necessarily be fixed and could be clustered based on different regimes. Importantly, the correlations also reveal whether the factors are actually distinct in their definitions - in a sense, it would be expected for the factors to act as independent principal components, although, as there may be shared qualities in their definitions, there may be similarities in their results and they may not be completely disconnected. It should also be acknowledged that it would be expected for the correlations between factors to increase as the number of factors increase, as there is a finite spectrum of unique information which can be extracted and overlaps have to occur as more factors are added to imperfectly fill in the remaining gaps.
.svg)
United States
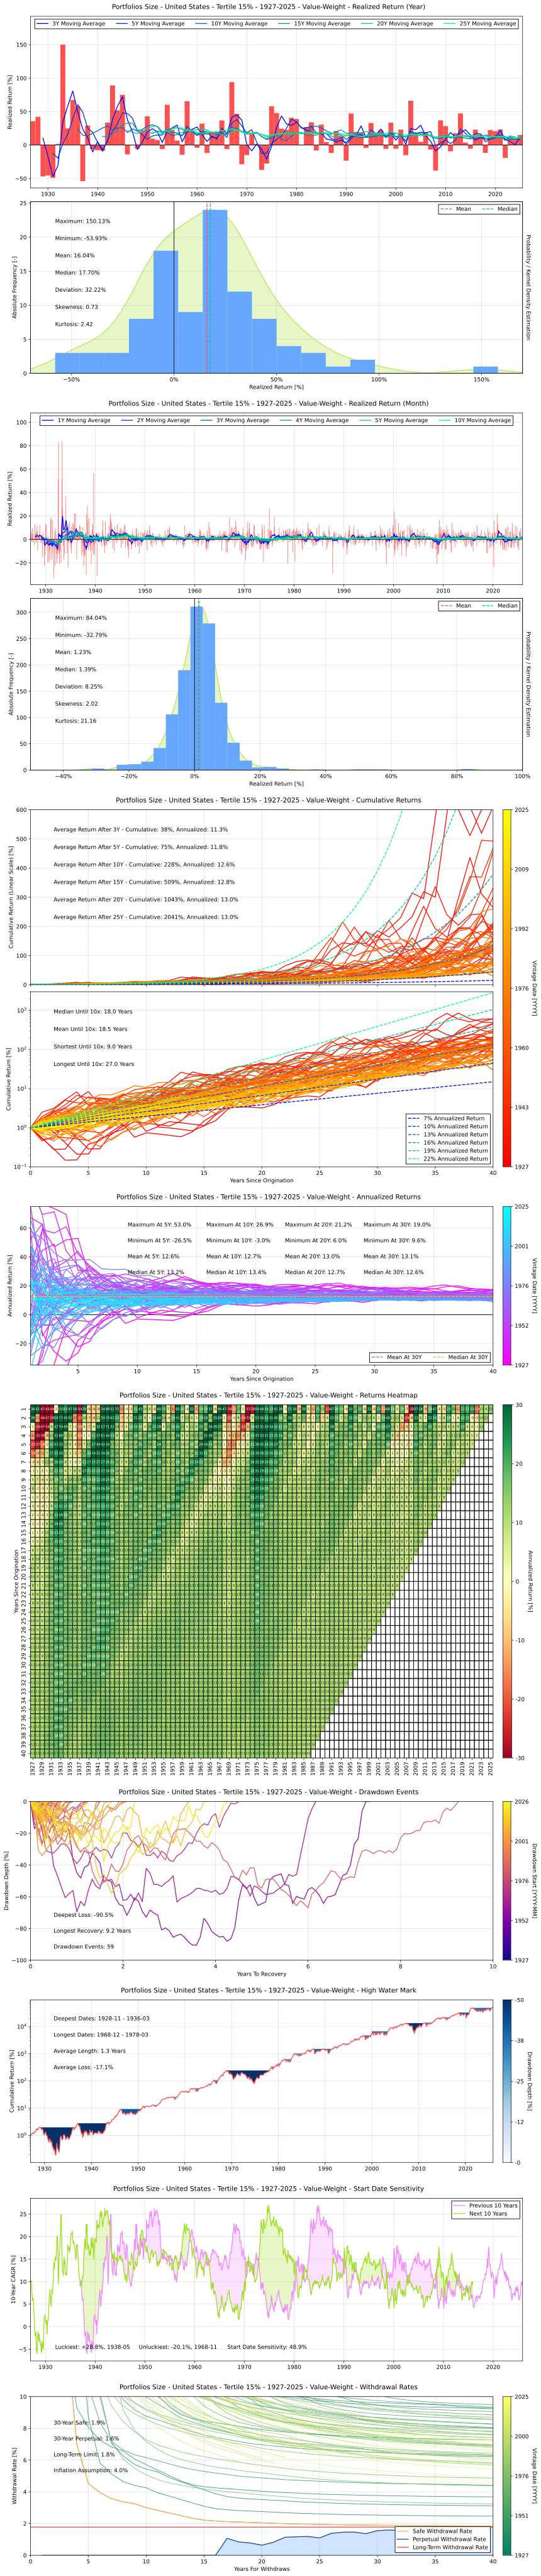
For this analysis, there is consideration for portfolios specifically constructed to target various combinations of factors. For example, a sort of portfolios can be formed by looking at the size factor and value factor using two groups for market capitalization and three groups for book-to-market equity to produce six portfolios ranging between equities with small market capitalizations, large market capitalizations, high book-to-market equity, low book-to-market equity, and neutral multiples. Similarly, the sort of portfolios can be formed by looking at the size factor, profitability factor, and investment factor using two groups for market capitalization, four groups for operating profitability, and four groups for change in investment assets to produce thirty-two portfolios ranging between equities with small market capitalizations, large market capitalizations, robust gross profits, weak gross profits, conservative investments, aggressive investments, and neutral multiples.
Developed Ex US
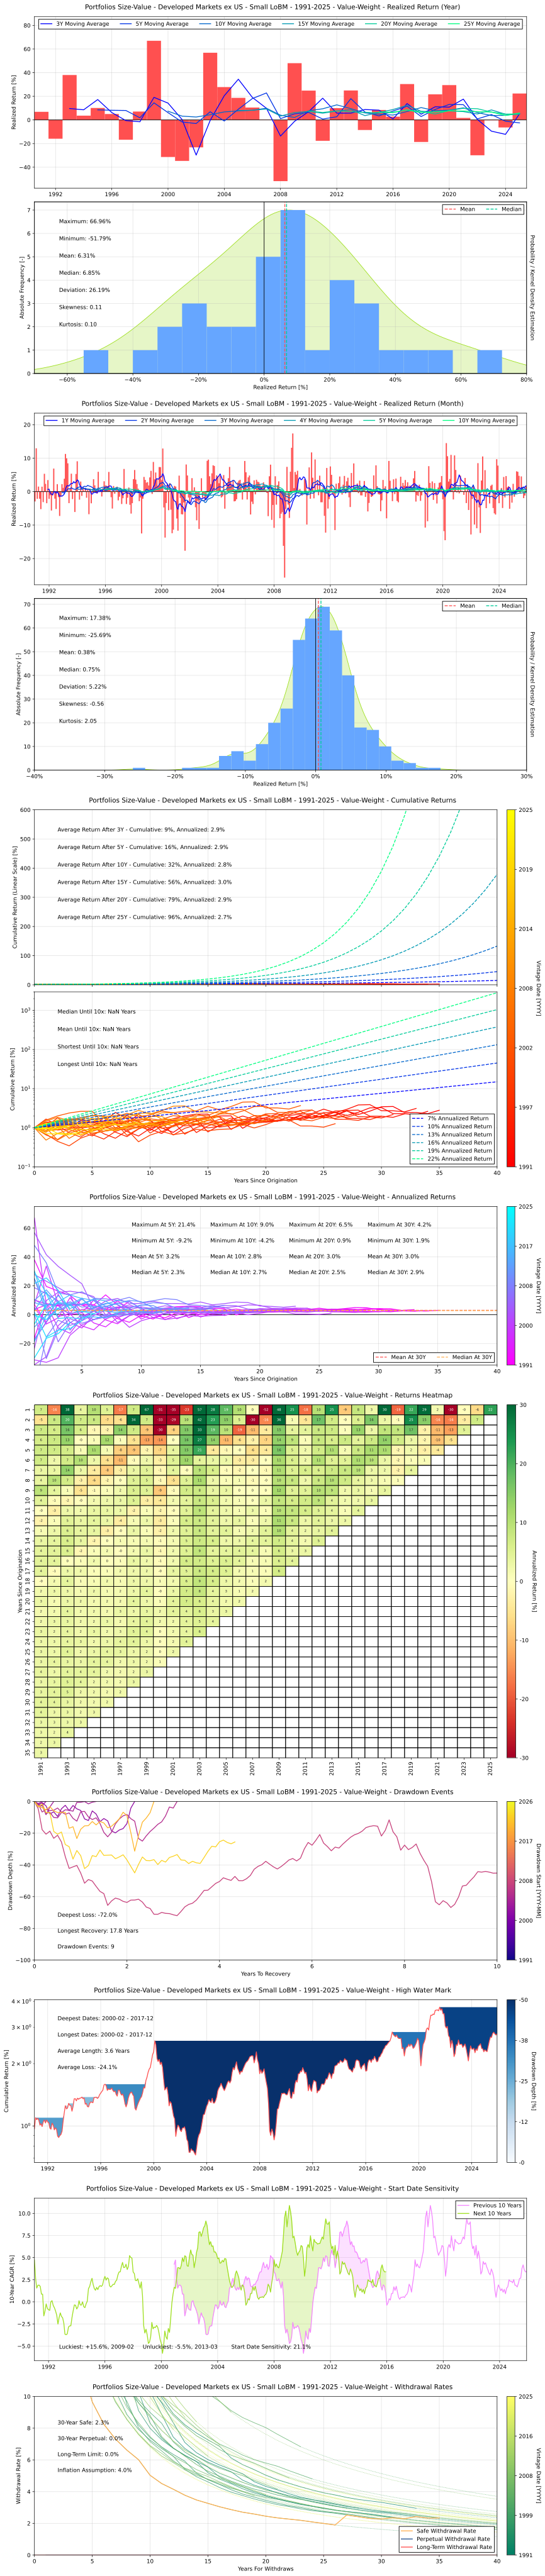
With regard to the regions, countries are grouped based on their classification as developed markets or emerging markets (which generally follows classifications from MSCI) and relative location with the extent of the data varying based on availability. The developed markets include Australia, Austria, Belgium, Canada, Switzerland, Germany, Denmark, Spain, Finland, France, Great Britain, Greece, Hong Kong, Ireland, Italy, Japan, Netherlands, Norway, New Zealand, Portugal, Sweden, Singapore, and United States. The European regions include Austria, Belgium, Switzerland, Germany, Denmark, Spain, Finland, France, Great Britain, Greece, Ireland, Italy, Netherlands, Norway, Portugal, and Sweden. The Asia Pacific regions include Australia, Hong Kong, Japan, New Zealand, and Singapore. The emerging markets include Brazil, Chile, China, Colombia, Czech Republic, Egypt, Greece, Hungary, India, Indonesia, Malaysia, Mexico, Pakistan, Peru, Philippines, Poland, Qatar, Saudi Arabia, South Africa, South Korea, Taiwan, Thailand, Turkey, and United Arab Emirates. A similar analysis can be performed.
Emerging Markets
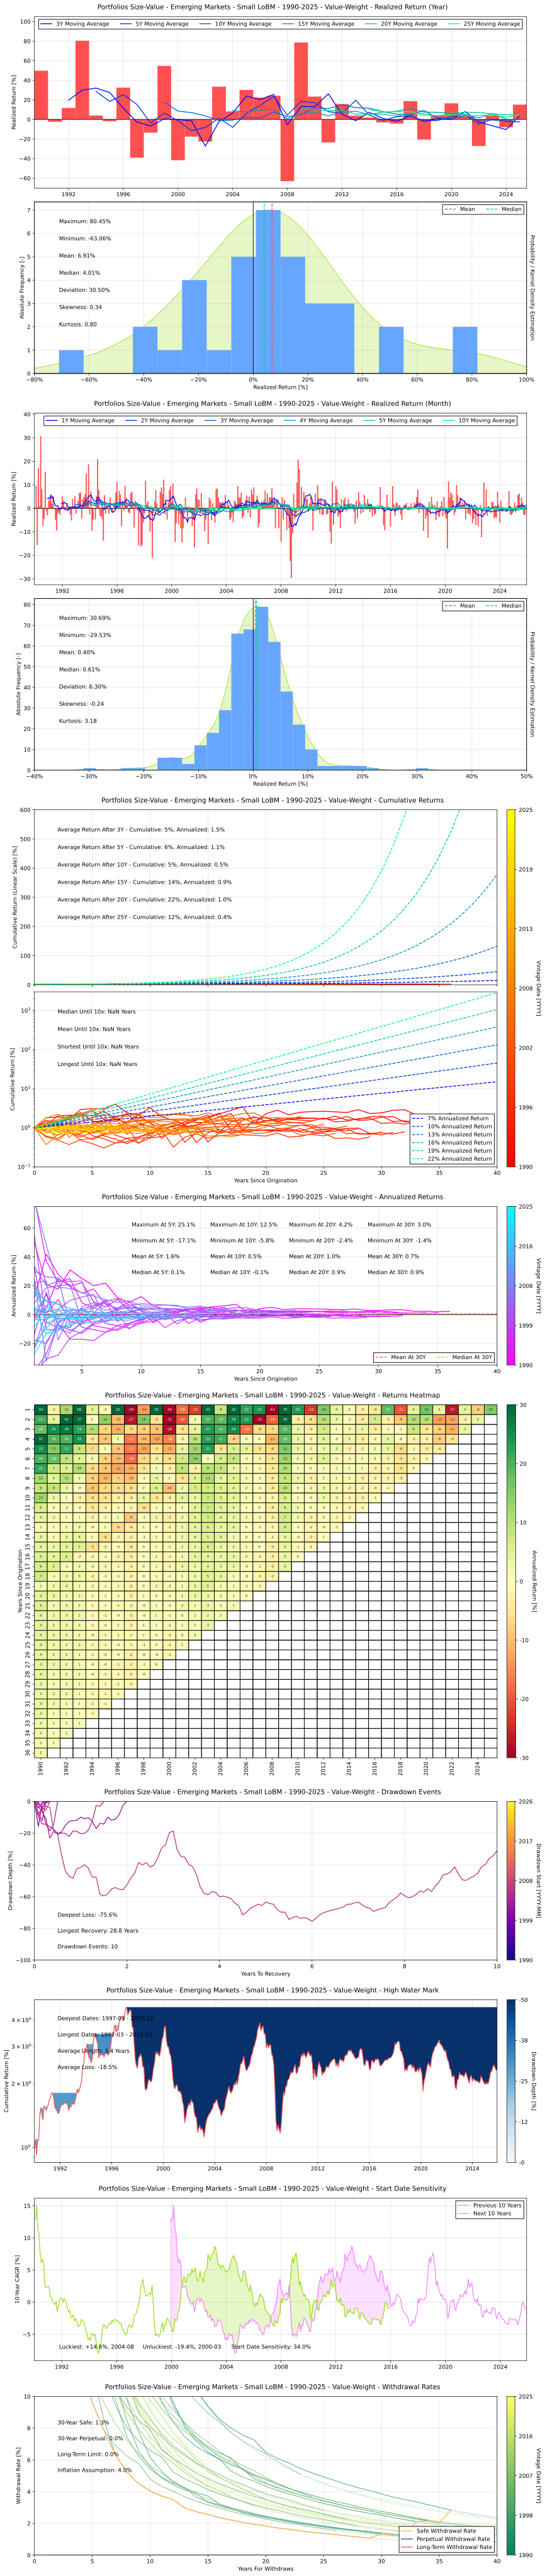
Lastly, the same approach extends to the emerging markets, where portfolios are formed from two-by-three sorts that pair the size factor with the value, profitability, and investment factors. Here the analysis is necessarily more modest, as the emerging market data only begins in the early 1990s and therefore carries a much shorter history than the data for the United States. The limited sample leaves these averages more sensitive to individual episodes, so the patterns should be seen as more suggestive rather than settled or mature.